Voter ID and turnout in GE2024
Since the last General Election one of the most significant changes to the UK election process has been the introduction of photo ID for voters voting in-person. Although it was piloted in 2018 and 2019 and was first used in local elections from 2023, Thursday’s general election was the first time all would-be voters had to show ID.
The UK is now aligned with much of the voting world on this aspect, but we may still expect there to be a negative impact on turnout given the UK does not have a national ID card system like France or Germany. Like with any new policy there are likely to be teething troubles, such as the previous veterans minister (Johnny Mercer) having to apologise for veteran’s ID cards not being included, Boris Johnson forgetting his proof of identity, and one Presiding Officer having to ask uniformed police officers to show another form of ID as their police IDs (which understandably require a high level security clearance) were not valid.
These examples all occurred at the 2024 May Local Elections. So, was it all plain sailing at the General Election? Some anecdotes reveal some of the challenges voters and administrators are dealing with. One of us was told about a woman in Southeast London who was turned away but returned after 2 minutes as she had found her Freedom Pass in the bottom of her bag. We were also told about polling staff having to double check that Iceland was part of the EEA as such ID cards are valid. These incidents obviously slowed the process in these specific cases but is there currently evidence that this voter ID is creating widespread issues, and if so for who?
To investigate this, we produced two estimates of the proportion of registered voters lacking qualifying photo ID for constituencies in England and Wales. We produced one set of estimates at ward level in May, and another set of estimates at the parliamentary constituency level in June. The two estimates are correlated but there is not a one-to-one correspondence. This may be due to reasons specific to how voter ID operates in the UK. If voters do lack ID they can apply for a Voter Authority Certificate, and some did so during the course of the election campaign. After the election was called (22nd May) up until the application deadline (26th June) 57,458 Voter Authority Certificates were applied for. Voters without ID could also apply for a postal vote or allow someone to act as their proxy.
We use these two sets of estimates to investigate the relationship between those lacking ID and turnout in at the General Election. We control for previous turnout to account for any overall change in turnout.
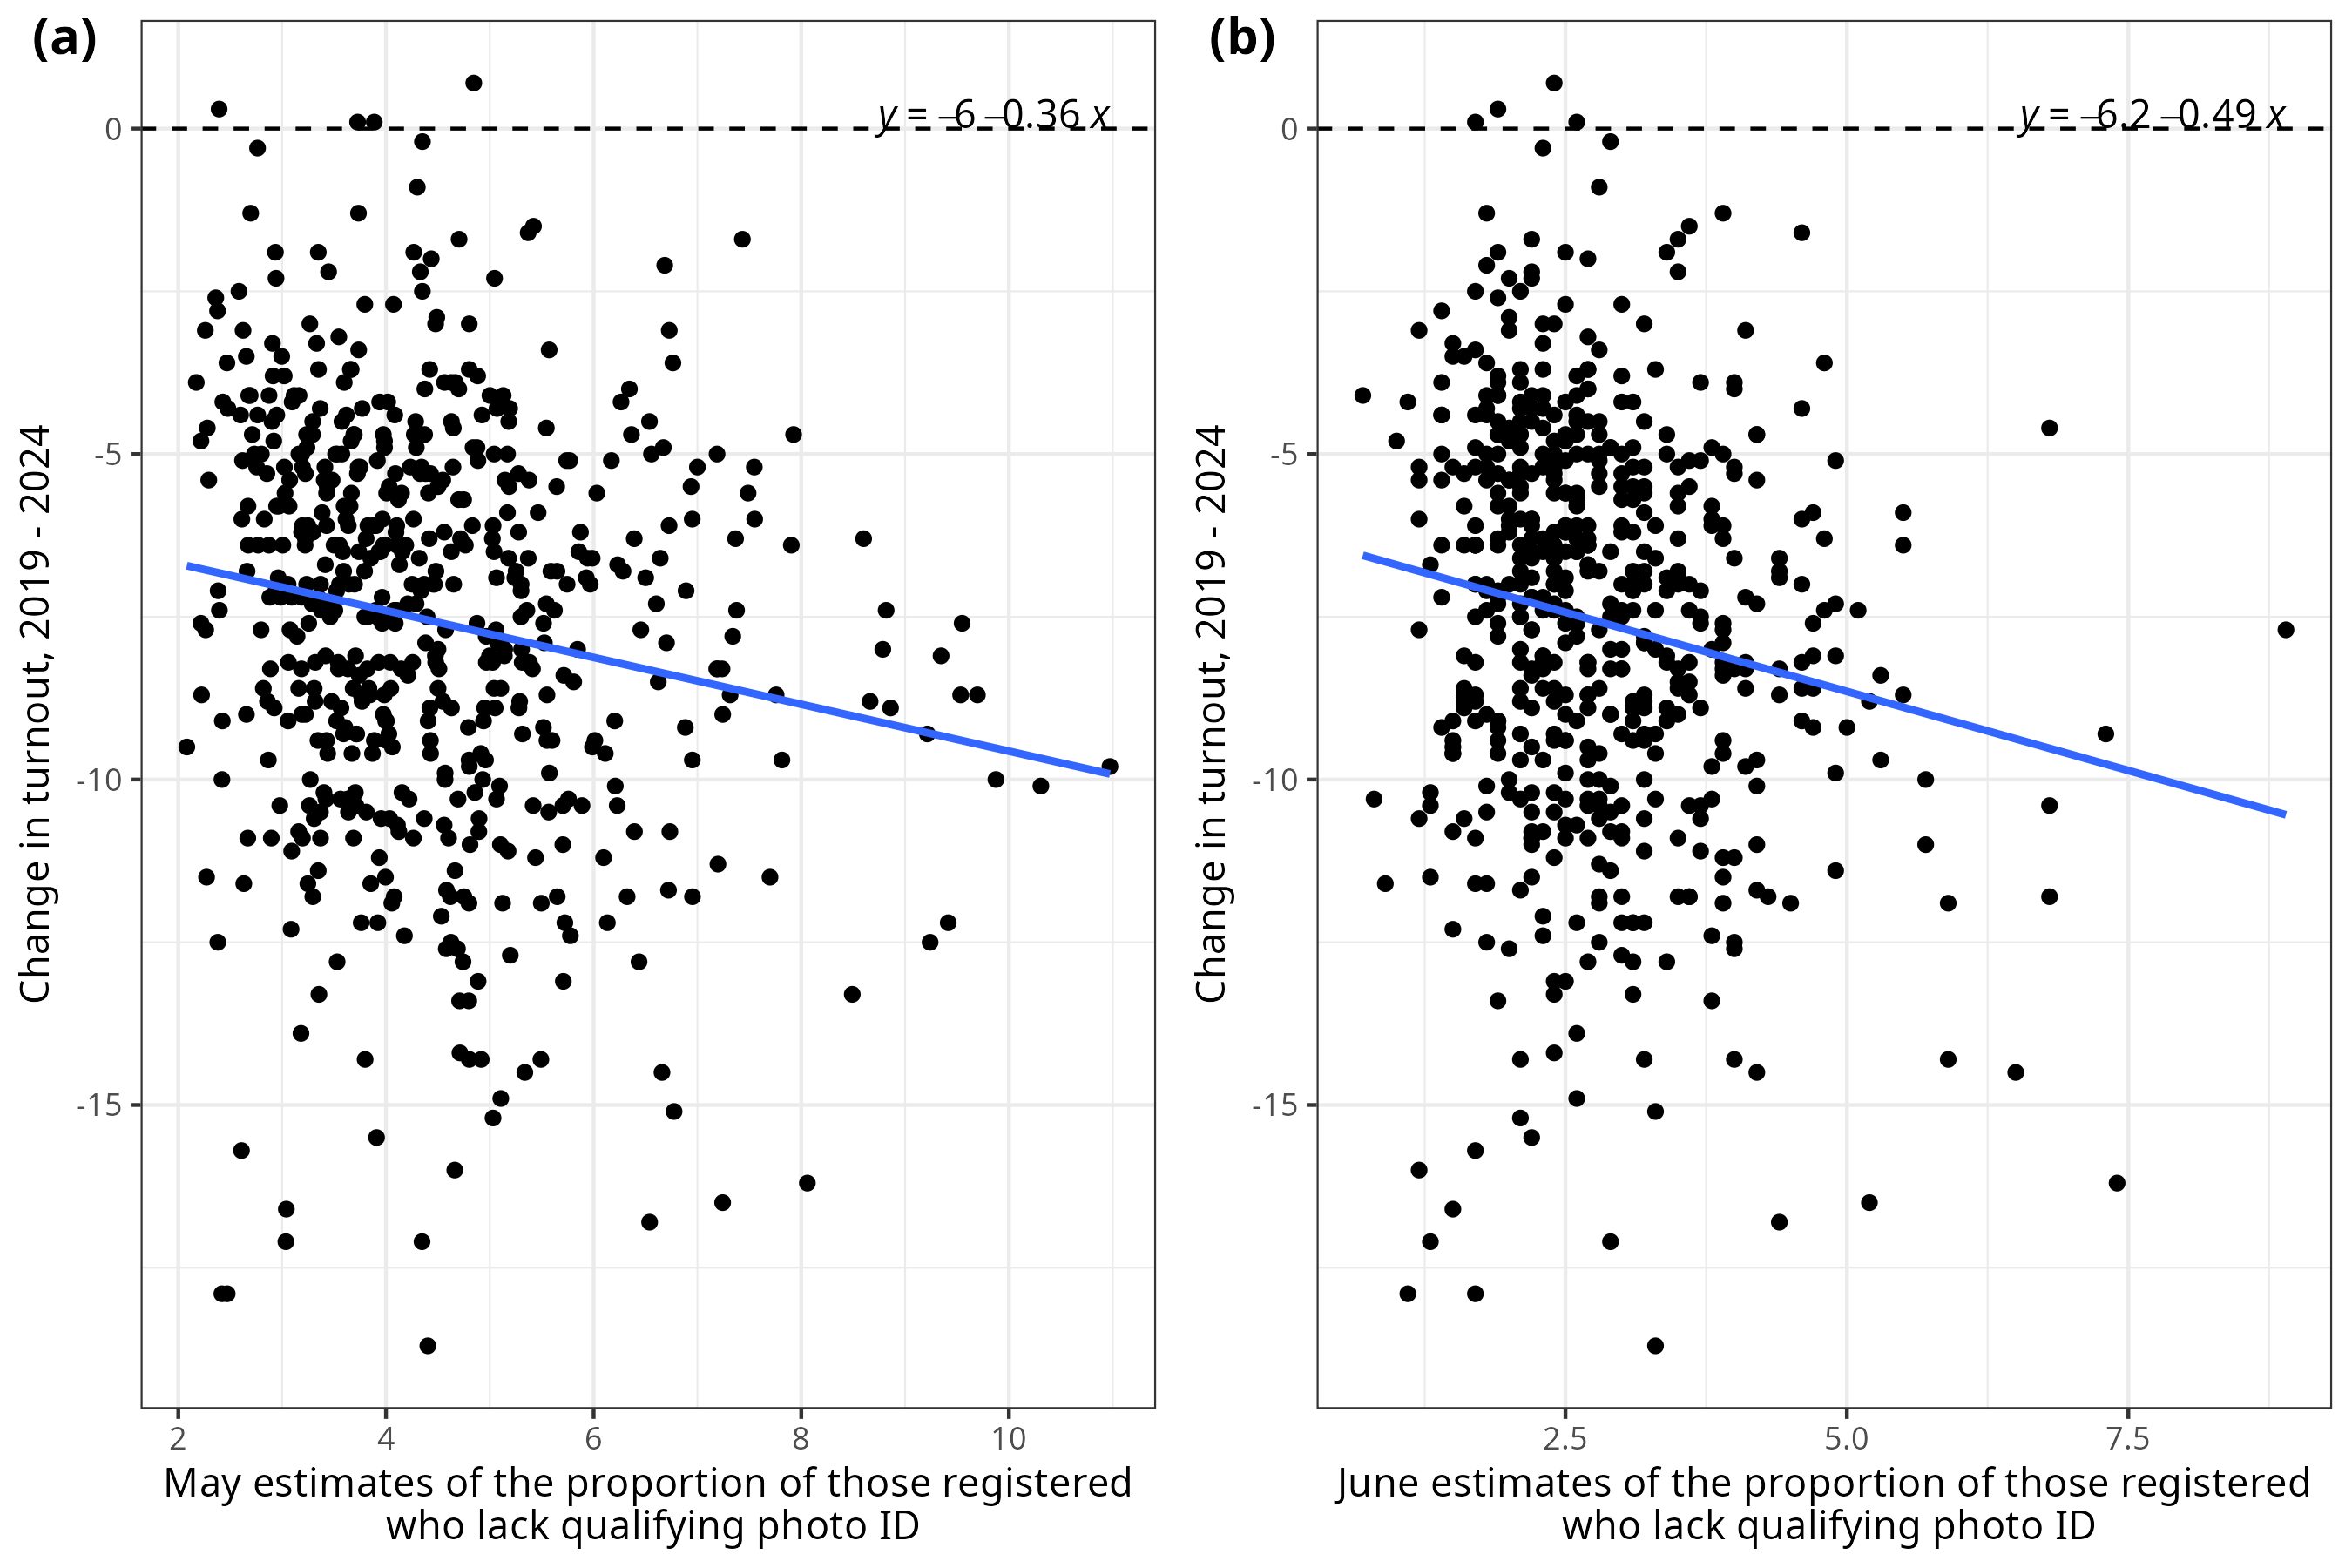
Whether we use the May or the June estimates, we see a statistically significant negative relationship between the proportion lacking qualifying ID and changes in turnout. Starting with the May estimates (plotted in Figure (1(a)): each percentage point increase in the proportion of registered voters who lack ID is associated with a 0.36 percentage point decrease in turnout. In the June estimates (plotted in Figure (1(b)), the relationship is stronger: each percentage point increase in the proportion of registered voters who lack ID is now associated with a 0.49 percentage point decrease. Although the relationship is stronger in the June data, the difference in slopes is not itself statistically significant. That is, whilst we can be confident that the relationship is negative, we can’t be confident that it’s “more negative” in June than in May.
Whilst these differences are statistically significant it still remains to discuss if these differences are meaningful in a substantive sense. In our May estimates the average proportion of registered voters lacking qualifying ID was 4.5 percent. This means that in the average constituency, we would expect turnout to be (4.3 times 0.36 =) 1.55 percentage points lower. If instead we use our June estimates, the effect is lower. In our June estimates, the average proportion of registered voters lacking qualifying ID was 2.8%, and so the effect of the voter ID requirement is now to reduce turnout by (2.8 times 0.49 =) 1.37 percentage points. These figures are consistent with figures from opinion polls which suggest that around 1.6 percent of those who intended to vote were unable to do so, although those figures include both individuals who were unable to vote and individuals who, though able, did not return after failing to show qualifying ID.
To put this in terms of number of voters, given that the average constituency has an electorate of 70,000 we could expect between 960 and 1085 fewer voters because of the new ID requirement. Could such a number make a difference to the overall electoral outcome? Given that seven seats were decided by less than one hundred votes, it’s very possible that voter ID affected the overall seat tally, if not the size of the Labour majority.
We’ve shown an association between the proportion who lack ID and changes in turnout, but this doesn’t mean that changes in ID requirements caused falls in turnout. It might be that areas which lacked ID were always going to see declines in turnout. This might be because these areas were drawn in to voting during the previous 2019 election, as a result of the focus on Brexit. In previous work, we noted that local election wards which lacked ID were already seeing turnout fall between 2018 and 2022 before the introduction of the new ID requirement. Our data is therefore helpful to identifying the effect of voter ID requirements on turnout, but is not conclusive.
To contextualise these results, we can look at what type of constituencies are more likely to have a higher proportion of those lacking ID, using the May estimates. The table below shows key demographics of the highest and lowest quartiles of constituencies lacking ID compared with the average across all constituencies. As can be seen, constituencies within the lowest quartile of ID ownership tend to have a larger Asian, Disabled and C2/DE population than those in the highest quartile. The opposite is true for the percentage of retired and black residents, but these differences are not substantively significant. The differences in the percentage of students are minimal. Therefore, the potential negative effects of lacking ID may be more strongly felt in different communities. This reflects findings from the United States of America and comments made by former MP Jacob Rees-Mogg.
| % of retired residents | % of Asian residents | % of Black residents | % of students | % of disabled residents | % of C2DE Residents | |
|---|---|---|---|---|---|---|
| Lowest ID Ownership | 21.42 | 10.63 | 3.63 | 5.75 | 19.45 | 44.25 |
| Highest ID Ownership | 21.52 | 7.96 | 4.71 | 5.5 | 15.34 | 29.39 |
| All Constituencies | 22.08 | 8.5 | 3.68 | 5.48 | 17.65 | 36.98 |
Table: Characteristics of areas with lowest and highest rates of possession qualifying ID.
So far, we can conclude that turnout was lower in constituencies where more people lacked valid ID, but whether this was due in full to the change in law remains to be seen. We’ve focused on turnout, but other outcomes also matter: a more restrictive ID law could affect also the perceived and actual integrity of elections.