Why we may never know the full effects of voter ID
In May’s local elections, voters in England had to show photographic ID before they could vote. This was the first time English voters (but not the first time voters in the UK) have had to show photographic ID to vote. Since not all people who have the right to vote have photographic ID, it’s natural to ask whether this new requirement had an effect on the number of people who voted.
We can get a partial answer to this question by tallying up the number of people who turned up to polling stations only to be refused a ballot because they lacked qualifying ID. This is a partial answer because there will be many people who lacked ID and didn’t turn up to vote because they (correctly) anticipated they would be turned away. We therefore want to know what the full effect on turnout of the new requirements is.
A number of us at the Democracy and Elections Centre recently tried to answer this question by producing ward-level estimates of the proportion of the voting eligible population (VEP) who lack a passport, and the proportion of the VEP who lack a driving licence. Since these were the two most common forms of identification in the voter ID pilots, we can get a proxy for the proportion lacking qualifying ID by multiplying (100% minus the proportion who lack a passport) by (100% minus the proportion who lack a driving licence).
Here’s a plot which shows the change in turnout between 2019 and 2023, as a function of the estimated proportion who lacked qualifying ID.
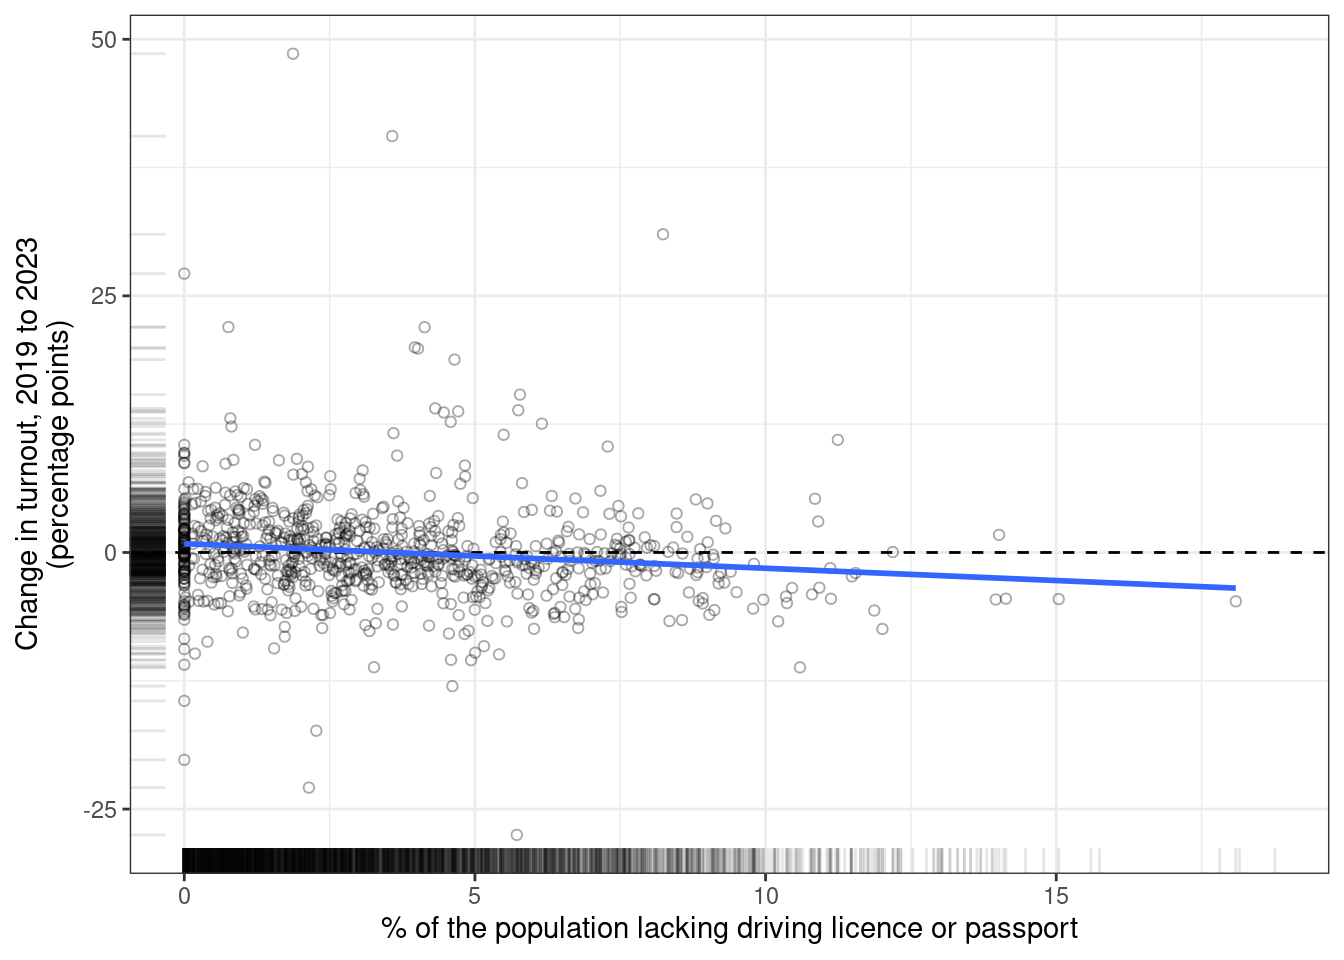
As you can see, the best fitting line slopes downwards: the more people lacked qualifying ID, the more turnout dropped. More specifically, for every percentage point increase in the proportion lacking ID, turnout dropped by 0.25 percentage points.
Is this good evidence that the new requirements caused a drop in turnout? Unfortunately not. The evidence shown in the figure can be interpreted as causal if a [“parallel trends”] assumption holds – if areas with high and low proportions of people without ID were always trending in the same way, even if they started from different points.
One way of indirectly assessing the parallel trends assumption is to conduct a placebo test – to suppose that the new requirement had been brought in a year earlier, and to run the same analysis on changes in turnout between 2018 and 2022. Since (by assumption) high-ID and low-ID areas share the same parallel trend, we shouldn’t see any association between the proportion lacking ID and the turnout in this “placebo” contrast.
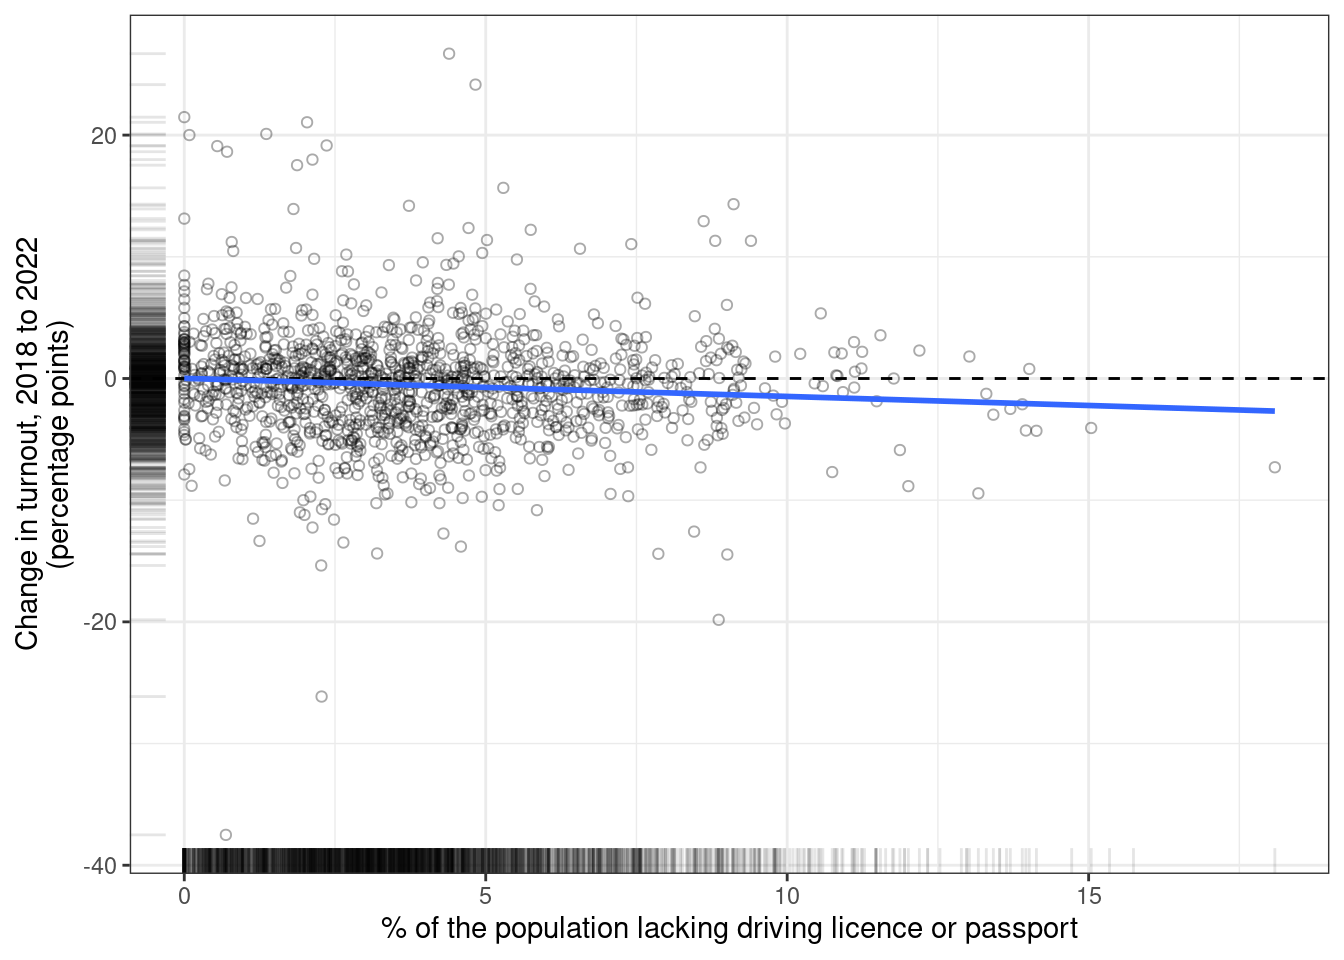
Unfortunately, as the figure above shows, we fail our placebo test. Areas with more people who lacked ID were already trending in the direction of lower turnout. As far as we can tell, the extraordinary Brexit-related events of 2017 to 2019 brought a lot of people in to politics who are now turning off – and lots of these people lacked photo ID.
The slope of this second line isn’t as steep as before (0.13), and so one could assume that the trend seen for 2018 to 2022 would have continued for 2019 to 2023, meaning that a one percentage point increase in the proportion lacking ID would cause a (0.25 - 0.15 = 0.1) percentage point drop in turnout – but that would be a bold assumption.
To some extent we know that voter ID reduces turnout because we see it in the numbers of people turned away. But it’s important to know the full effects of voter ID. Sadly, in our case we had to agree with the statistician John Tukey that “The combination of some data and an aching desire for an answer does not ensure that a reasonable answer can be extracted from a given body of data”. It might be possible to answer this question at a later date, and in particular to compare turnout in 2026 local elections in England (which has a voter ID requirement for local elections) and Wales (which does not). But for now, we just don’t know.