Polarization and the number of parties
Polarization is a vital (and popular) concept when talking about politics. If everyone in a given country is either a fascist or a communist, we’d describe that country as polarized, in many different ways. Similarly, if the two largest vote- or seat-winning parties in a country are fascist or communist, we’d describe that country’s party system as polarized.
For a long time, political scientists have treated the polarization of a party system as the second most important characteristic of a party system behind the number of parties. But they’ve typically taken these two things to be unrelated.
For example: Russell Dalton, writing in 2008, claimed that “polarization can vary nearly independently of the number of parties”.
In a recent article for Electoral Studies, I show that this isn’t the case. Polarization increases as the number of parties increases, but it increases most quickly when moving from a small to a medium number of parties, and only increases very slowly after that. In other words, the relationship is non-linear.
To explain the relationship between the effective number of parties and polarization, I need to explain two things about the measurement of polarization.
- Measures of polarization are based on measures of party positions. Different project measure positions in different ways: some will use a -100 to +100 scale, whilst others a 0-20 scale. To put all these measures on the same scale, I scale them so that they have a mean of zero, and a standard deviation of one.
- The most common measure of polarization is like a weighted standard deviation. It measures how spread out party positions are, weighting larger parties more.
What do we know about standard deviations? We know that if there is just one observation in our sample – or, in the case here, just one party in our system – then the standard deviation is zero. There’s no party system polarization in a one-party state.
That might sound like a stupid observation to make – but it helps frame our intuitions about the relationship between the effective number of parties and polarization. With one party, polarization is zero, and so can only increase from there.
What about another, perhaps equally stupid scenario, the scenario where there are an infinite number of parties? Let’s imagine we hadn’t read any of the abundant literature on party positioning, and we just assumed that parties’ positions were random draws from some global distribution of parties. As we drew more and more party positions, we’d gradually become just as dispersed – just as polarized – as that distribution. We don’t know the true global distribution of party positions – but we do know the distribution of party positions in our data, and we know that’s been standardized to have a standard deviation of one. We might suppose then that as we add more and more parties, we more slowly approach this value of one.
What about the vast majority of positions in between these two extremes, with more-than-one and less-than-infinity parties? Here we can draw some inspiration from something taught in introductory statistics classes. If you have a random sample of data, the mean of that sample is your best guide to the mean in the population. That is, it’s not consistently biased in any particular direction. (If it was, the sample wasn’t random). But the sample standard deviation works differently. It’s a poor guide to the standard deviation in the whole population, because it’s downwards biased. The fewer objects you have in your sample, the worse the bias. At the limit, with one object, your sample standard deviation hits zero and becomes an infinitely bad guide to the real population standard deviation.
Researchers correct for this using something called Bessel’s correction. You take your sample standard deviation, and multiply it by your sample size divided by your sample size minus one.
Here, though, we’re not in the position of having a sample and wanting to work back to the population standard deviation. We think we know the overall standard deviation of party positions (it’s been standardized to a value of one), and we want to know what the standard deviation will be like for the number of parties in our system. We need to flip the correction around, and multiply by our “sample” size (the number of parties) minus one, divided by our sample size. If we have three parties, we’d multiply one by two-thirds; if we had four parties, we’d multiply by three-quarters, and so on.
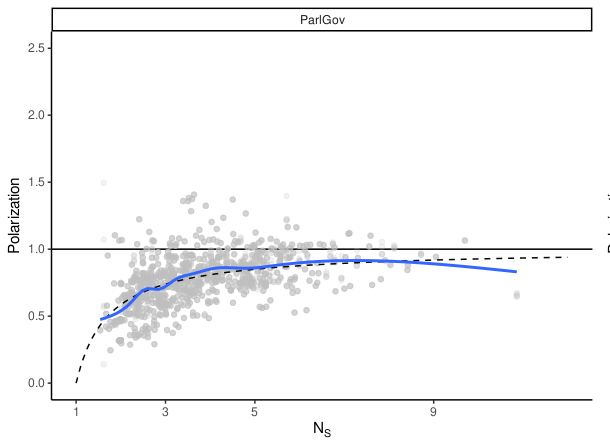
Figure showing polarization as a function of the effective number of parties in data from ParlGov. The blue line indicates the best fit to the data, while the dotted line indicates the function identified in the article
In practice, it’s not as simple as this – there’s a difference between the raw number of parties and the effective number of parties – but across four different data-sets I show that the best guide to polarization is a curve that slopes steeply upwards at the early part of the curve, before tailing off. It’s my hope that this relationship can guide researchers who are considering the effects of reforms which might change the number of parties, and with it, the degree of polarization.